Low-code IoT Platform & extensive solutions for connected business
One-stop shop for all your IoT needs. Empower your business by developing scalable IoT applications over the platform easily or augment readily available IoT solutions catering to multiple verticals.
Our expert will get in touch with you shortly.

Crafted for data-driven digital transformation
Zoho IoT offers a cloud application enablement platform to build simple to complex custom applications to meet your unique requirements. Also, explore our extensive collection of ready-to-deploy solutions without having to build from scratch.
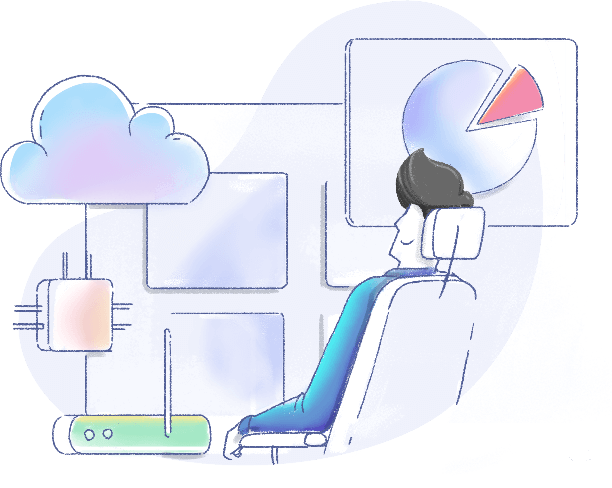
For developers to build & deploy
Simple & Secure Low-code platform to develop cross-domain IoT applications with top-notch features.
Platform Features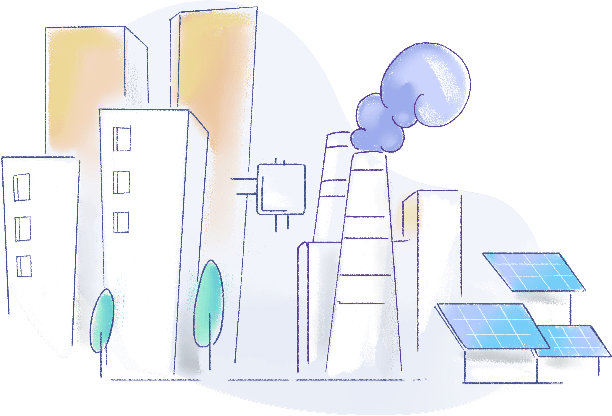
For enterprise to plug & play
Pre-built solutions catering to Buildings, Energy & Utilities, Industrial IoT, etc., for OEMs, Resellers, MSP's, & End customers.
View SolutionsSecure, swift, and scalable low-code platform

Connect
Secure and seamless tech-agnostic connectivity made easy. Eye the requirement, indulge your imagination, build bespoke vertical apps & win bigger deals.
Develop
Build simple to complex IoT applications - Dashboard-only apps to Enterprise-grade apps using modelling, visualization, and automation tools.
Analyse
Filter out the noise of cluttered data and leverage advanced analytical capabilities to organize real time insights, identify inefficiencies, predict consumption.
Deliver
Achieve rapid deployment with faster time to market, low execution risk, fully integrated security, cost-effective & scope to scale.
Develop a wide range of vertical solutions
Smart Buildings
Smart building solution controls and monitors the building's mechanical, electrical and complex automated systems such as HVAC, DG/chillers, lighting, power systems, fire systems, BMS and security systems etc. to reduce energy usage, maximise operational efficiency & the well-being of occupants.
Smart Utilities
The solution acquires, manages and reports vital data from Power/Water/Gas meters such as I/O voltage, I/O current, water flow, velocity, pressure, Leakage etc. Energy managers & utility companies can target the consumption pattern & perform demand planning, Fault management, maintenance, Forecast etc.
Smart Cities
Various solutions like Street lighting, traffic monitoring, Water management, Air quality etc. promote citizen engagement, improve the overall well-being of its patrons, modernize urban mobility, simplify public services, scale up security, optimize cost, & secure assets at multiple geographic locations.
Energy Management Solution
The solution includes planning & management of your energy consumption patterns in commercial & industrial sectors. Our Energy management Solution takes complete control of your energy data at a fundamental & granular level while reducing your energy costs.
Asset management
The Solution provides real-time insights on Asset performance, Condition monitoring, Asset workflow automation, Predictive maintenance, Asset utilisation, Energy comparison metrics, etc. Increase the asset performance, uptime, and longevity and reduce total cost of ownership (TCO) and capital expenses.
Green field point solutions
Tailor-made solutions developed from the scratch with the latest technologies, standards & protocols to address specific requirements of an organization across schools/colleges, restaurants, retail, healthcare, agriculture, etc. that focuses on digital transformation and future-proofing their business.
Industrial IoT Solution
For a Smart factory, it is vital to monitor machines and processes in real time as well as ensure optimal performance to improve production. The solution help improve overall equipment effectiveness, minimize equipment failure, improve shop floor efficiency, and enable proactive maintenance to reduce downtime.
OEM solutions
The connected smart products regime is evolving rapidly to extend the life of OEM products and pave the way to new business services. Bundle the OEM products like water heaters, vending machines, etc. along with Zoho IoT to make it smart and tap the machine-as-a-service market with quick ROI.
Build end-to-end IoT applications with top-notch attributes

Device Management, Configuration Management, OTA
Manage scaling IoT devices with ease
Enables registration, provisioning, authentication, monitoring & control, troubleshooting, telemetry, firmware upgrades for IoT devices/assets at scale with device certificates & policies.
Health monitoring, location hierarchy, maintenance
Accelerate & enhance asset productivity
Content change- Model assets and associate with any devices to maximize asset availability, meet SLAs & deliver substantial cost savings. Get enterprise-wide visibility on asset performance and minimise unplanned downtime with predictive & scheduled maintenance in check.


Multi-device, Multi-protocol, Multi-communication
Secure and seamless device connectivity
Provides seamless connectivity to a wide variety of sensors & gateways, supports standard protocols- HTTPS MQTT, CoAP, BACnet, etc. and easily links with various wired/wireless communication channels.
Edge Computing, Data Collection & Processing
Intelligence right at the edge
Collects, processes & acts on IoT data at the edge, push filtered data to the cloud, and manage devices locally with faster response time. Increase offline operations, reduce cloud traffic, & deploy custom logic directly to edge devices.


Incident Management, Automatic Alerts, Notifications
On-time alerts on real-time anomalies
State-based rule engine generates alerts and escalates to actions & custom functions. Determine asset condition, reduce downtime, and timely responses to unplanned events notified via email, SMS, etc.
Dashboards & Widgets, KPI Metrics, Reports
Visualise data to actualise decision making
Turns complex IoT raw data into actionable insights by monitoring, analysing, comparing, & forecasting to identify hidden trends, patterns, bottlenecks, etc. Optimize business productivity with dashboard builder and custom field builder.


GeoMaps, Indoor/Outdoor Maps, Asset Tracking
Locate all your assets in a single map view
Intuitive visualization to find where all your assets are located. Asset tracking makes it easy to quickly locate the physical locations of your assets along with all the asset details in one place. Pin your assets independently or cluster them together.
AI-based Predictions, Forecast Reports, Asset Maintenance
Detect anomalies & predict asset downtime
Deliver measurable business value & ROI using artificial intelligence, machine learning, and advanced analytics. Also, perform trend analysis, detect anomalies, track consumption patterns, etc.


Remote Monitoring, Command Audit, Command Widgets
Remote control your assets effortlessly
Control device or assets by sending commands remotely to adjust device behavior and detect patterns. Ping, remove, get, reset, set point temperature, discover points, etc., are a few commands to trigger actions to keep the process going.
Tenant hierarchy, Profile and User Management
Multifaceted cloud IoT paradigm
Allow tenants or group of users to create their own multi-tenant applications that operate in a shared environment with a single URL for each tenant. Create multiple independent tenants, define roles, manage access, etc. all within the application.


Data security, Encryption, IAM, & GDPR
IoT lacking strong security is Internet of Threats
- End-to-end encryption using HTTPS/ MQTT protocol
- Identity & Access Management for authentication & authorization of users & devices
- Privacy to ensure user sensitive data is carefully handled with strict privacy policies
- Compliance to standards that sets benchmark to security
Explore an array of vertical solutions tailor-made to elevate your business

Industrial IoT
Monitoring machines in real-time while ensuring optimal performance is crucial. Our solution helps valuable assets to improve OEE, minimise downtime and equipment failure, proactive maintenance, etc.
Explore
Smart Facility Solutions
Create intelligent spaces that dynamically respond to changing needs and promote sustainability, safety and comfort. Monitor operational efficiency, reduce costs, and improve user experiences in diverse environments with real time insights, automation and connectivity.
Explore
Indoor Air Quality
Keep check on air quality. Manage temperature, humidity, CO2 concentration, particulate matter, VOC, bacteria & fungi, etc., from anywhere across the globe.
Explore
Water Management
Manage real time water consumption across premises. Continuously monitor tank/sump level, water flow/pressure, temperature, consumption metering, water quality, leakage alerts, etc.

Solar panel monitoring
Monitor and control arrays of solar panels proactively to improve efficiency. Record and analyse data on energy generated & utilized, inverter/battery voltage, photo-voltaic module temperature of solar panel glass.

Smart Building
Deploy single building systems for BMS, BAS, and EMS. Fire & Safety, Access systems, facilities, etc., to reduce energy usage, maximize operational efficiency, and improve comfort.

Energy/Power Management
Plan & manage energy consumption patterns in commercial & industrial sectors. Take full control of your energy data to enable energy efficiency, benchmarking, M&V, forecast and analytics.

Smart lighting
Monitor energy, emissions, and health of indoor/outdoor light fixtures. Perform efficient lighting operations with reduced maintenance, overall cost, & manpower.

EV Charger monitoring
Manage and operate EV charger stations across locations. Track exact charging time, weather, electricity consumption, carbon footprint reduction, connector status, etc.

Asset Management
Gain real-time insights on DG/Chiller/AHU systems. Perform condition monitoring, predictive maintenance, utilization, energy comparison metrics, etc., to increase efficiency, uptime, and longevity of assets.
Extend your IoT reach with our global partner ecosystem
We collaborate in partnership with the world's leading IoT experts to arm your business with the right platform and deliver cutting-edge solutions to your customers.

Want to be an early adopter?
Become a PartnerHaving a strong affair with IoT for a decade
As WebNMS (Ex-division of Zoho), we had been building solid expertise in the IoT market for over a decade in research and development of IoT platform & solutions.
“Zoho IoT offers state-of-the-art IoT platform with comprehensive cloud capabilities and top-notch attributes built over Zoho’s robust cloud platform (Where business applications were built & trusted by more than Million users across globe).”
